

Overview About ReSkued
ReSkued is a startup that is backed by Cargill and Google. Their mission is to work towards a waste free world, by minimizing and redistribute surplus inventory. Rescued redistributes inventory at a distributor level at a discounted price to customers (or resukers)!
Let’s get started with the Dashboard!
For a little background about the project, the preliminary research and discovery was done over the fall of 2022 by my teammate Kalyn, I joined the project the following spring and contributed through the later half of the research process with competitor analysis, ideation and the design stages.
Recap of the discovery and preliminary research done by Kalyn.
What caused manufacture and distribution level food waste? There are many contributor factors such as surplus, close expiration date, cosmetic imperfections, and many more. We wanted to understand why a potential customer would choose to utilize ReSkued to source inventory compared to other distributors. Using a journey map to understand what would some key indicator that would motivate a customer to use ReSkued. Utilizing a dynamic dashboard will allow users and customers to stay engaged and updated with the current stages of the market, by having visualizations of the market, data, insights, and purchase trends.
Initial Dashboard Design
Here is where I jumped in! The original plan was to jump straight into lo/mid fidelity designs as well as content mapping. We later learned that that specific approach was not successful in this situation.
We decided to go back top square one, white boarding and proper content mapping and strategy.
Final Dashboard Design
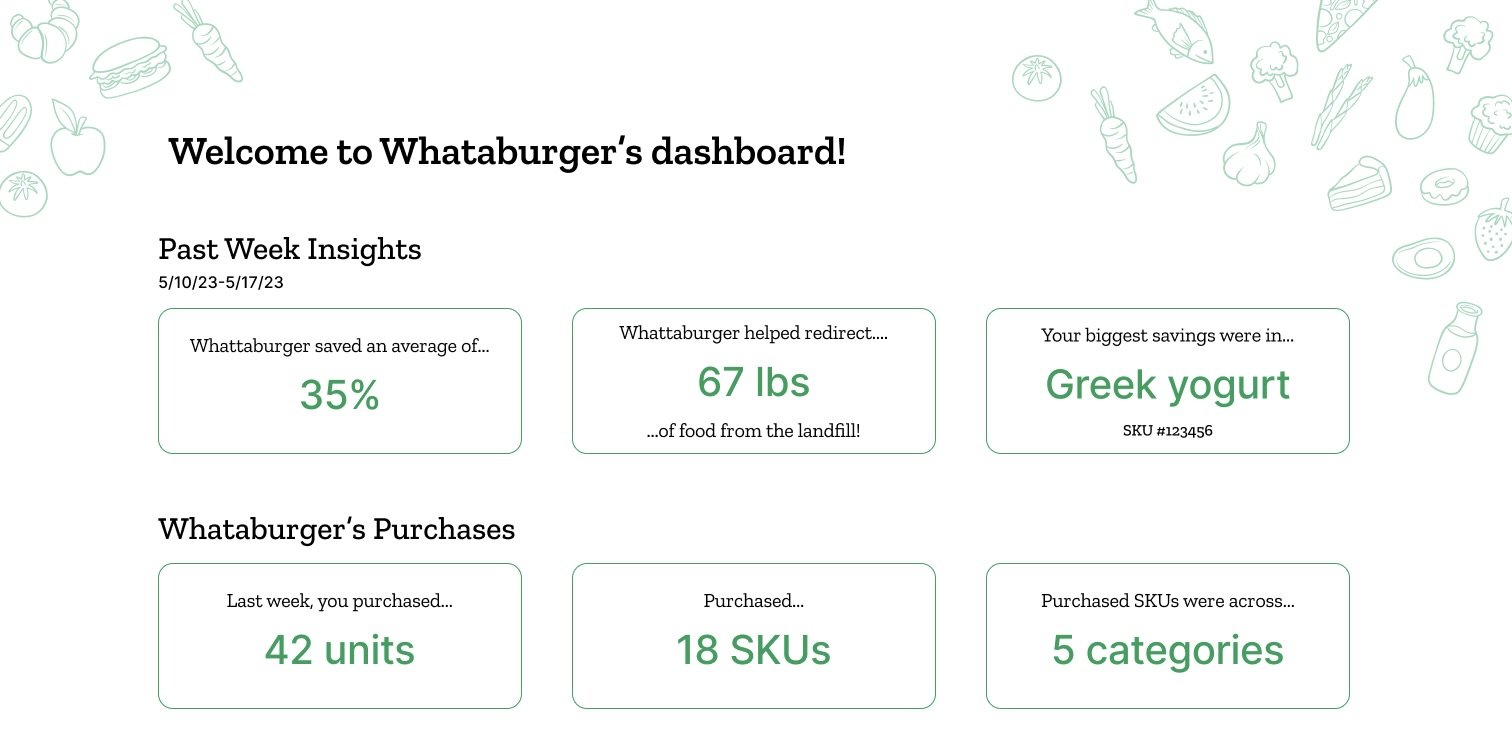
Cost Savings Snapshot
Overview of a customers spending and purchases can help the user put into perspective what they are saving on.
Displaying biggest savings made can further encourage the user to keep purchasing from the marketplace.

ReSkued
Cargill Innovation Lab Spring 2023
Duration: Jan - May 2023
Team: Kalyn Watt, Miranda Ma
Role: UX Designer
Tools Used: Figma, Microsoft Suite, FigJam
Problem
Each year 119 billion pounds of food is wasted in the United States. Which is equivalent to 180 billion meals. Around 30 - 40% of food manufactured food is wasted.


Community Impact
A community section to understand the contributions a certain user is making and the contributions in their community, friendly competition for food waste redirection.

Solution
Target food waste re-direction at a distributor level with an online marketplace and an analytic dashboard.
More about the product:

Affinity Mapping
We made an affinity map to find what would the customer and viewer want to see or prioritize to see, and what data would impact their buying decisions and influence their knowledge on food waste which would hopefully inspire them to purchase from the ReSkued market place.

Past Week Insights & Purchases
Starting off with the web view of the dashboard, we have some key performance indicators to show what the past week insights are at a glance.

Users Impact
Having a goal influences and motivated users to purchase more from the market place, we created a bar chart to do so.
The amount of food redirected overtime displays the impact a specifc user has made.

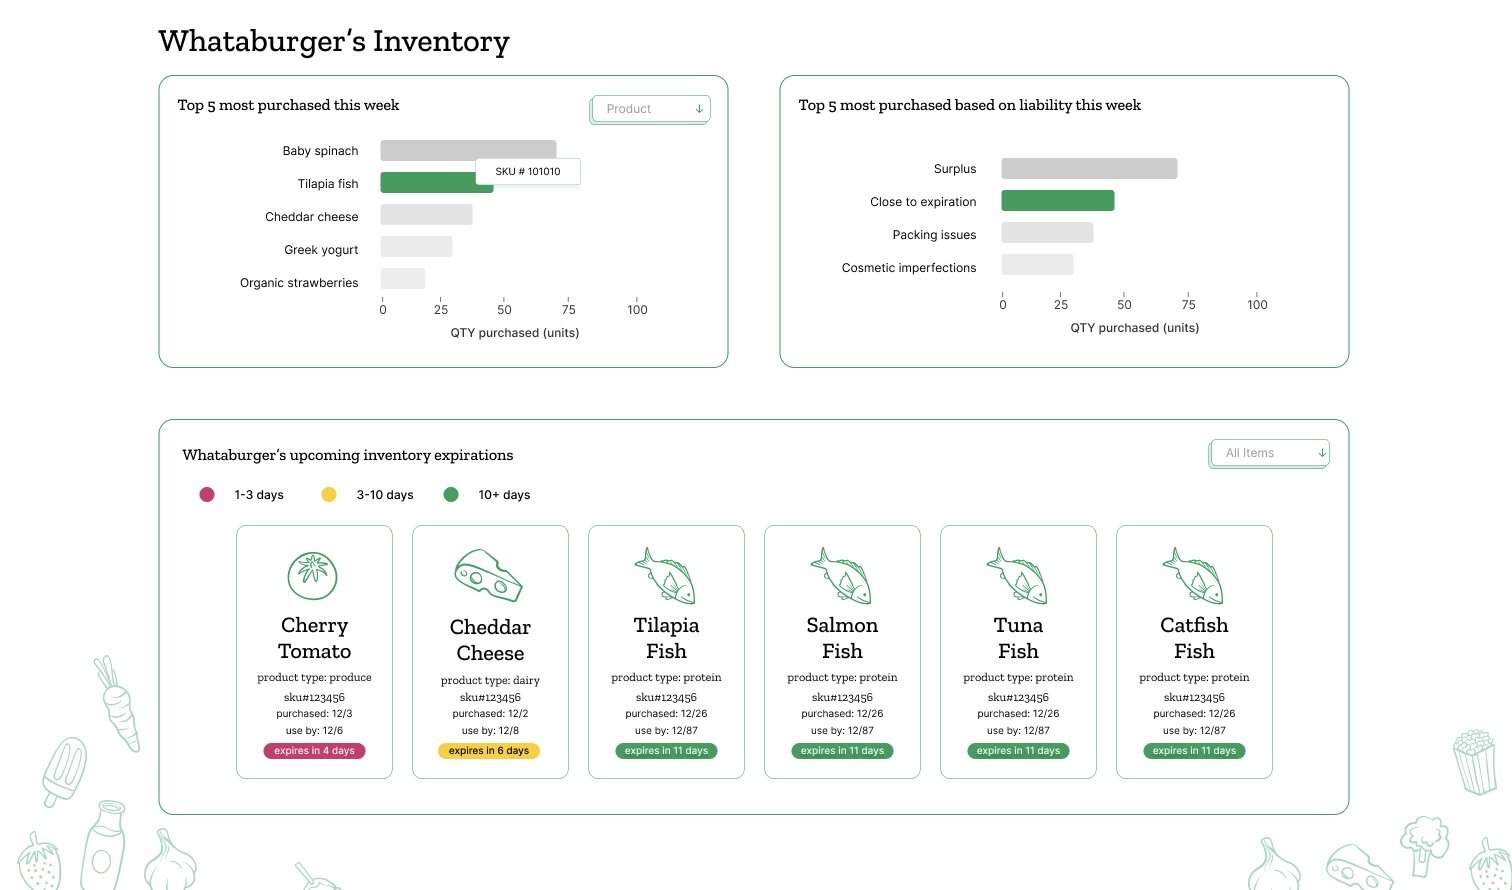
Personal Inventory
Displaying personal purchase trends in liability and inventory items. Shows users what items in their inventory are from the marketplace, and what liabilities they tend to purchase from.
A module to keep track of personal inventory and upcoming expirations to make sure no food and inventory goes to waste!
Mobile Dashboard/Newsletter View
The mobile view essentially took the most relevant modules on the web dashboard and converted for mobile viewing. We redesigned the KPI modules and simplified the personal purchasing trends.
The biggest difference is the upcoming expirations module, for the mobile view, there are linked recipes that can help users use up their inventory and influence and encourage trying new ways to use up their food, instead of it letting it go to waste.
Final Thoughts & Personal Reflection
I feel so fortunate to be able to work on this project, with my team and my extended product team. This project has pushed me in a lot of ways as a designer. I will also like to thank my amazing partner Kalyn, for being a great designer to work and collaborate with. I learned a lot about industry design standards and dash board design. A dash board that is this user data heavy is not something that I have worked on before. I personally really enjoy visual design, and the provided branding was a blast to work with. This project has also allowed me to learn a lot about food waste and food waste on a distributor level. Not only did I gain new design experiences, but also new insight on food waste and how I can contribute as a consumer. Thank you for viewing this project and let’s strive to build a greener earth!