


TORRIS
Hack4Impact UIUC Spring 2023
Tools Used: Figma, T3 Tech Stack, GitHub
Duration: 14 weeks

The University of Illinois System (UIS) publishes investment data as an appendix to their annual report, which is the singular current source of publicly accessible UIS investment data. However, the annual report is way too technical, and without prior knowledge or an economics background it is difficult to understand. The data is overwhelming, hard to read, hard to search, and hard to analyze. There is no additional focus on environment.
The Solution
An interactive & dynamic web interface to visualize the University of Illinois Systems’ Investment portfolio, with a focus on assets invested in corporations that profit from the extraction, transportation, or combustion of coal, petroleum, or natural gas.
The Product


The homepage is split up to 4 sections. This section is the “our requests” section. An interactive feature I created is the drop down effect. Maintaining the information hierarchy and adds a level of interaction for the users, to entice further reading.

Admins can update the databases through this interactive chart like view. The idea is that when there is an error in the database, the cell turns red. An admin can than later edit that specific cell, as well as submit a comment with the request.

Request management is where admins can view the progress of their own requests, as well as review requests made by other admins.
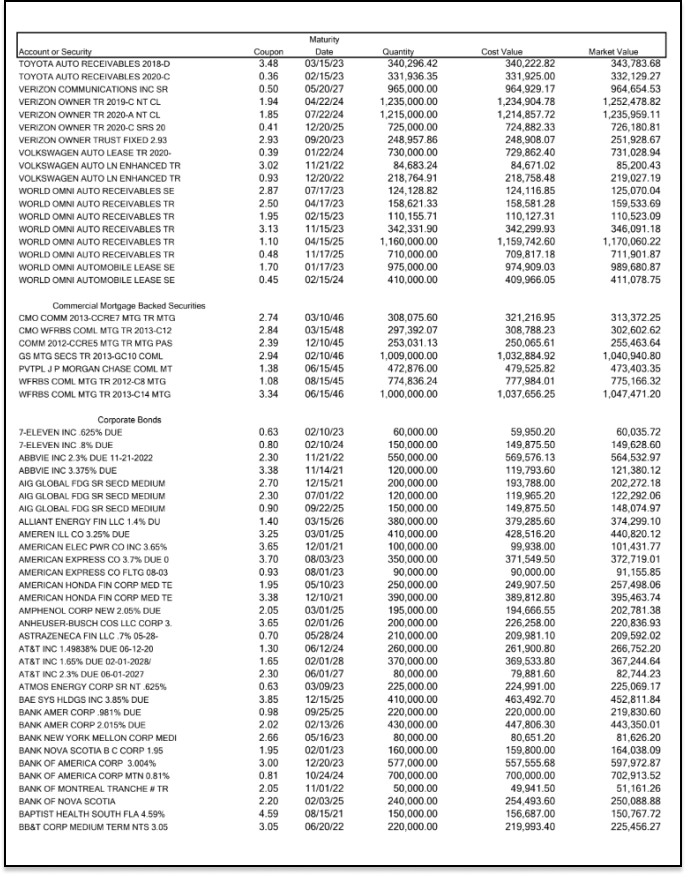
How the data is now. This data is currently the only source of public assessable UIS investment data
Our job is to inform, visualize, interpret, and promote the data while spreading a green earth initiative.
Interactively explore UIS investments over the year
Visualize and interpret the complicated data
Spread the importance of clean energy,
Transparent and Open Resource for Institutional Investments

Learn About Investments


Home Page
Here is an example…
Starting off with the homepage! There are two navigation bars to guide users through navigating the content heavy website. The secondary navigation sorts through the home page, and the primary navigation sorts through the main three pages of the site.
Overall, the site is very content heavy, my goal was to design an interactive site where content is more digestible for the user. Utilizing different design styles to display data and content.
The learn about investments page is a searchable database that allows users to learn about a specific companies investments. There is a search bar as well as different filters to pin point a specific company, or companies within a metric or range.
When the desired company is selected, it opens up the specific company page. Each company has a specific sector, industry, net asset value, and environmental grade. When the environmental tooltip is activated, it shows the average grade value for the sector the company falls under.
Using apex chart, we inputed graphs related to Carbon Accounting, CDP Fuel, CDP Energy, and Yahoo Finance. The graphs are interactive to display details related to each topic for the users to engage with. Lastly there is an investment details chart that lists all the different investment details by category, and there is also buttons for the users to sort by quantity.
Administration Control
There are three features of the Administration Control. Website management, administrative management, and requests management.

Administrative management allows the current admins to manage/update the admin list. The admin can either remove an admin, or remove them from the email list. There is also a functionality to invite admins as well.

Product link here
Disclaimer * Designs changes and updates have been made since handoff, not all work in the final product was done by the H4i team!

Team:
Project Manager: Jocelyn Xu
Tech Lead: Zora Zhang
Product Designer: Miranda Ma
Software Developers: Alex Masgras, Eesha Baura, Liza George, Anthony Cruz Macedo, Daniel Moon, Xiaofan Li
Let’s get started!!!
Full product link here
For a little background, Hack4Impact is an organization that partners with non-profits to create digital solutions and products. The goal is to build products that do social good and benefit a community. The organization is split into different project teams per semester, and each project team is partnered with a unique non-profit to create, build, and advocate for.
My role on the team: I am the only product designer on the team, which indicates that I need to take ownership of anything design related. Working closely with the developers, the PM, and clients to ensure the best results in the product.
Meet The Clients
Students for Environmental Concerns(SECS) aims to promote environmental action on campus by spearheading campaigns and collaborating with other organizations on projects that lead to a greener Earth.
Their mission includes maintaining the natural world's stability, promoting sustainable food, and pursuing clean energy both on and off campus.
The Current Problem….
Final thoughts & personal reflection …..
This project as a whole has pushed me in so many ways, especially as a designer. I would like to thank my awesome team for such great team work and collaboration. As well as SECS for working with us together to create this product. As the only designer on the project, I had to learn how to take initiative and be proactive in learning and developing new skills. It was challenging at times, but overall super rewarding. I learned about myself, and especially improved as a designer technically. I hope this project can help the audience learn more about the environment and our earth!!